
TL;DR Deploying all these changes and a new host, gave us a 500% boost, and 760% with page speed enabled.
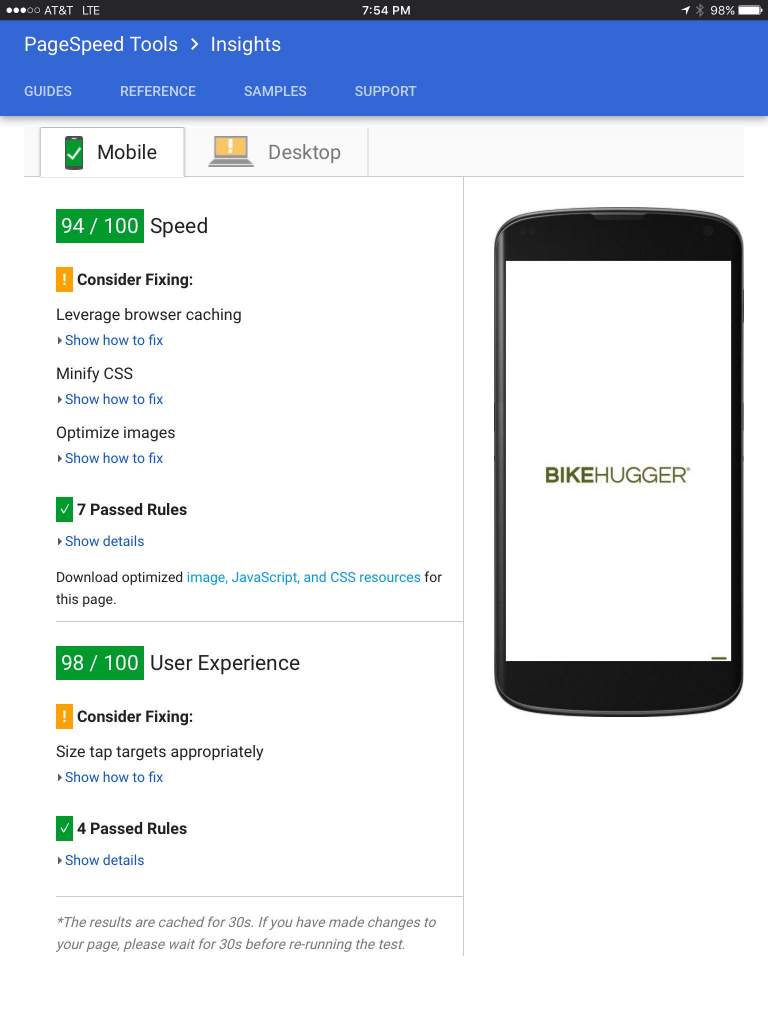
Speed the blog we did and the results show it. Our best scores so far —94/98— and the warnings under the speed heading are from Google’s own resources, ads, and analytics. The tap targets are the next fix.
The desktop warnings are Google wanting more compression for the larger viewports; meaning we’ve got more configuring to do for the best compression across devices. Our CMS is showing compressed versions for mobile and not for the desktop.
If you’re interested in speeding up your blog or site, check these resources below. I’ve been obsessed with it ever since I saw the spike in mobile traffic.
Our short content hiatus was during our move to a new server with Arcustech. And, now with the infrastructure in place, it’s back to our regular programming.
More Speed

For even more speed, see the AMP version of our posts, and a few reasons for investing in performance:
- 53% of mobile site visits are abandoned if pages take longer than 3 seconds to load
- The average load time for mobile sites is 19 seconds over 3G connections
- The average mobile page makes 214 server requests
Resources
- AMP HTML
- Page Speed Insights
- Why Marketers Should Care About Mobile Page Speed
- Strangecode —admin
- Robert Jolly—developer
- Arcustech—host
Our Own Testing
Benchmarking with ‘ab’:
Old server @ http://216.243.171.65/
Requests per second: 6.80
New server @ http://origin-www.bikehugger.c
Requests per second: 35.02
New server via pagespeed @ https://www.bikehugger.com/
Requests per second: 51.57
Deploying all these changes and a new host, gave us a 500% boost, and 760% with page speed enabled.
Also published on Medium.
…We're riding townies, adventure, and mountain bikes. Find recommendations on our store page. As Amazon Associates we earn from qualifying purchases.